Introduction
This article provides a structured overview of the principal cost factors associated with drone light shows in 2025. It synthesizes typical pricing ranges, regional differences, supplier models, do-it-yourself (DIY) considerations, and a brief comparison with traditional fireworks displays. The objective is to present clear, practical information for event planners, municipal authorities, and organizations evaluating aerial light displays.
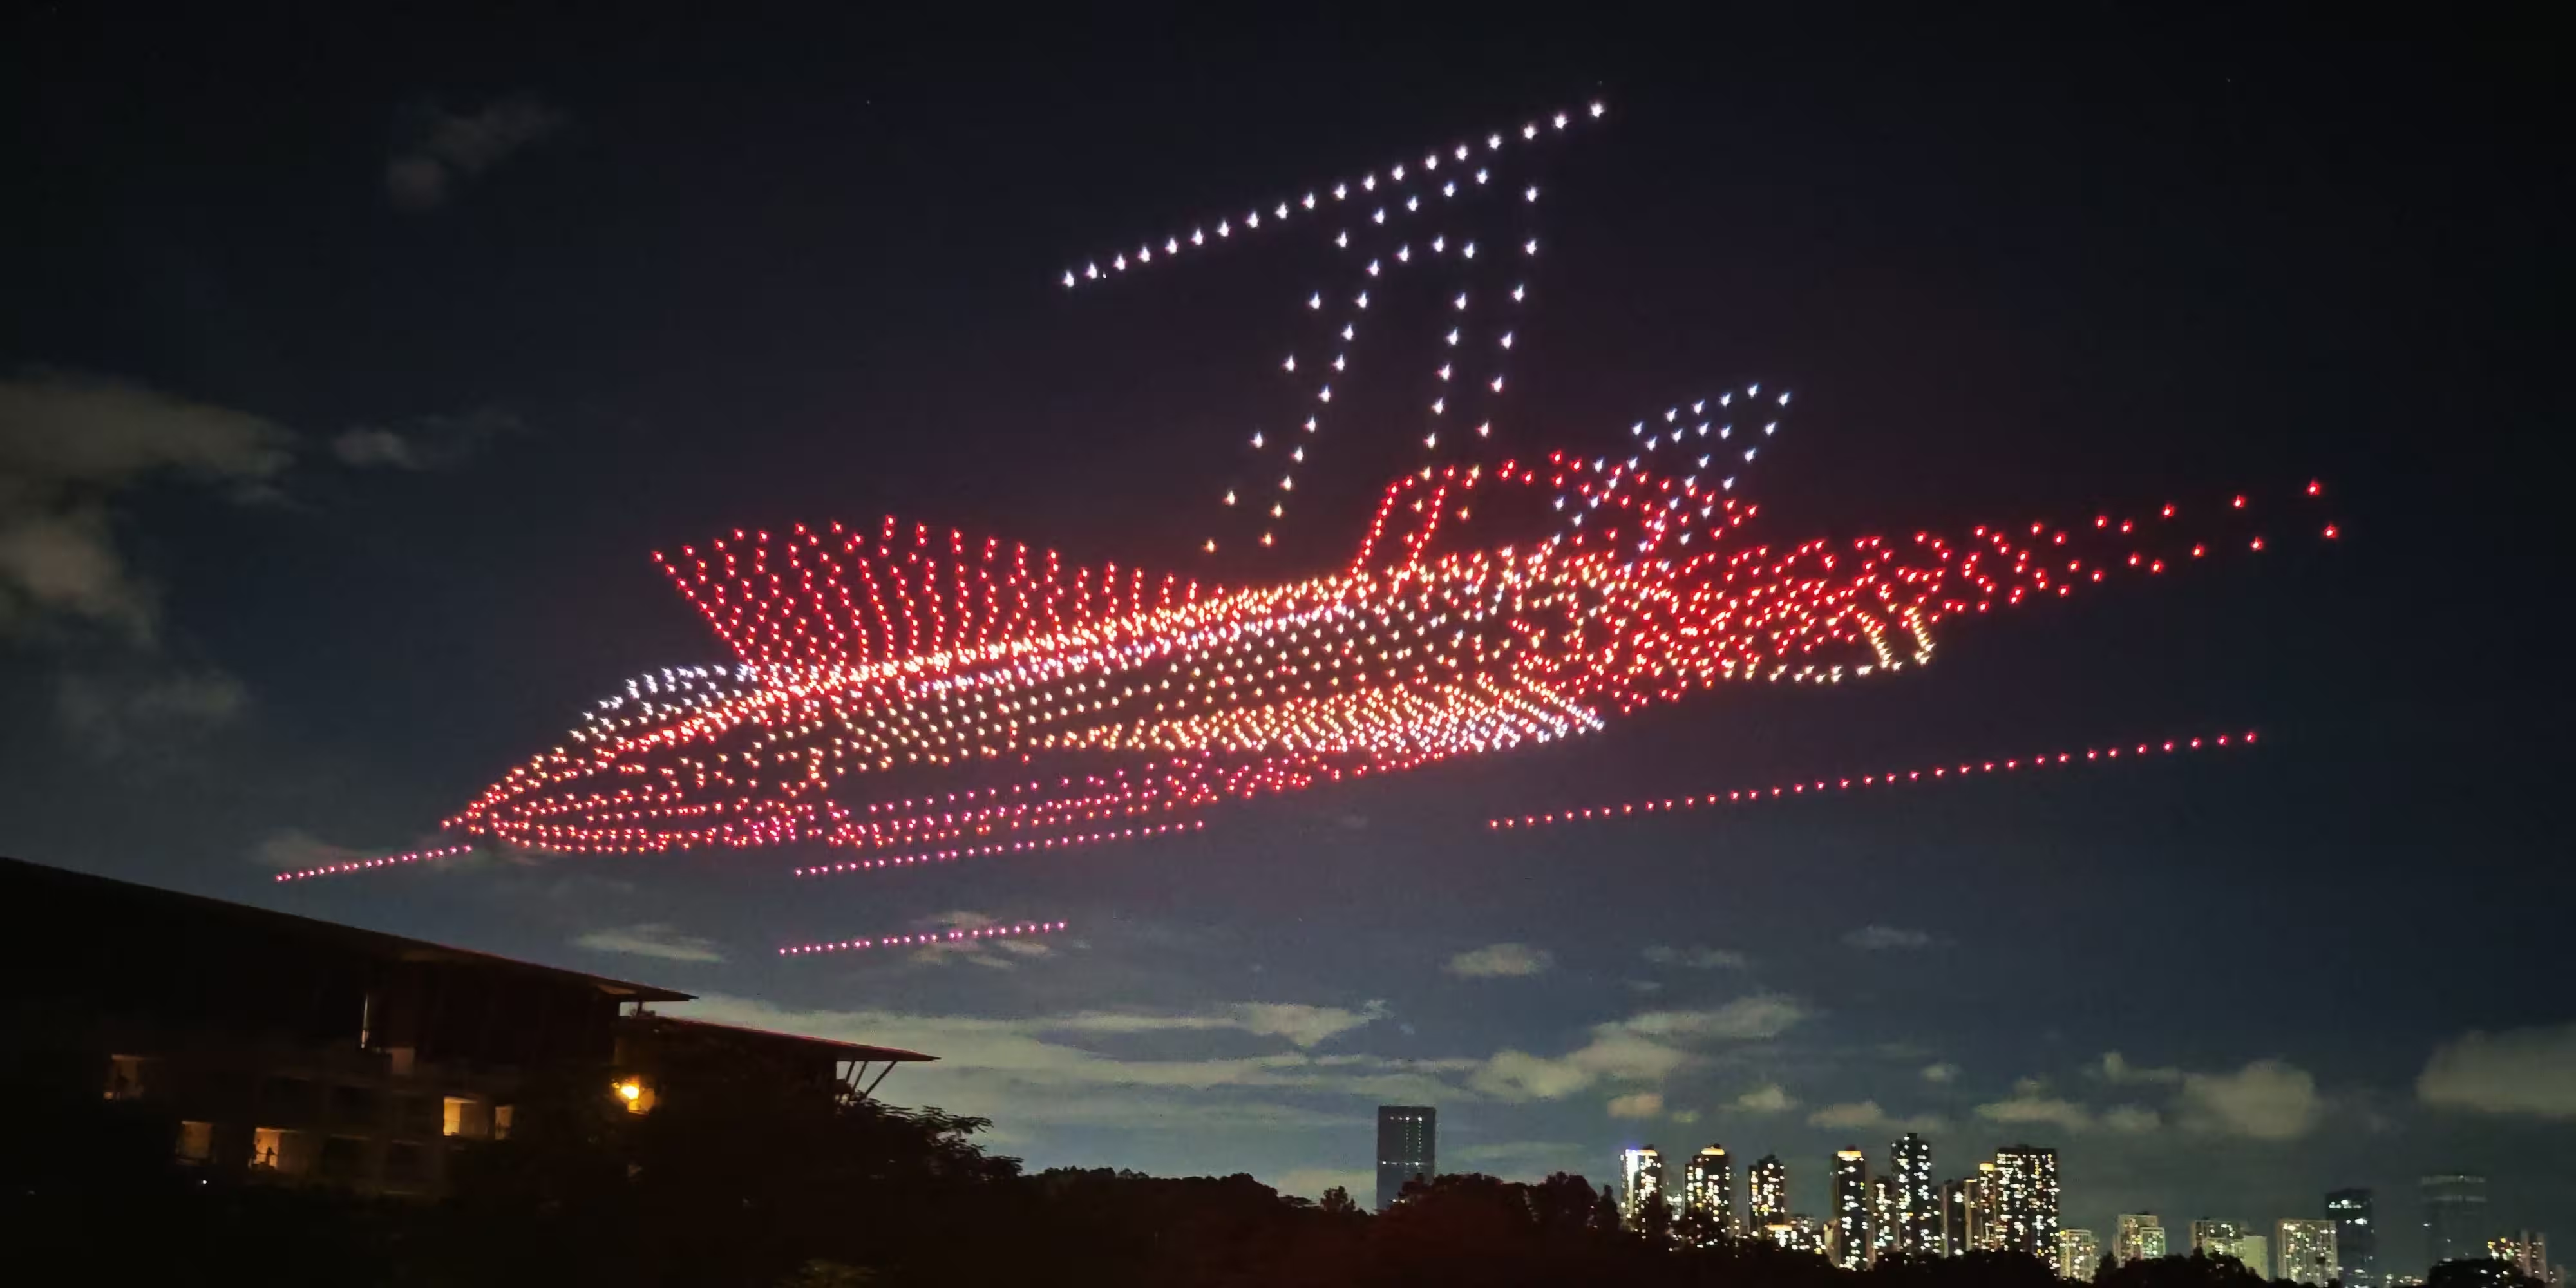
1. Cost Estimates by Fleet Size
Cost estimates for drone light shows are commonly expressed in relation to the number of drones deployed. The following figures represent typical market reference ranges and should be treated as indicative; actual pricing may vary according to creative complexity, location-specific regulations, and supplier services.
- Small show (~100 drones): Approximately $20,000–$30,000.
- Medium show (~300 drones): Approximately $60,000–$90,000.
- Large show (500+ drones): Pricing commonly begins in the $100,000s and can reach higher depending on complexity.
A commonly cited per-drone market reference is in the range of $200–$300 per drone, though per-unit effective cost will differ with scale and included services (e.g., choreography, licensing, insurance, logistics).
2. Regional Cost Variation
Regional market conditions produce substantial differences in total show cost, average fleet size, and per-drone expenditure. The table below summarizes typical regional patterns observed in industry analyses.
| Region | Representative Average Spend (USD) | Average Fleet Size | Approx. Cost per Drone (USD) |
|---|---|---|---|
| China | $114,564 | 660 | $175 |
| Middle East & North Africa | $112,250 | 401 | $316 |
| India | $91,700 | 396 | $330 |
| United Kingdom | $90,570 | 257 | $309 |
| Asia-Pacific (ex. China) | $58,440 | 307 | $195 |
| North America | $52,455 | 218 | $233 |
| Europe | $42,034 | 182 | $227 |
| Latin America | $25,550 | 115 | $218 |
Key observations: regions with larger average fleet sizes may exhibit lower per-unit costs due to scale economies. Variability reflects regulatory complexity, local labor and logistics costs, and supplier market structure.
3. Supplier Models and Typical Pricing
The market comprises full-service show providers, hardware manufacturers, and emerging vendors offering both turnkey services and component packages. Pricing and service scope vary by provider; examples of typical market positioning include:
- Turnkey show providers — deliver choreography, operations, permits, insurance, and on-site execution. Pricing ranges from entry-level shows to high-end productions depending on scale and creative requirements.
- Hardware vendors and system integrators — sell or lease drone fleets and control systems; additional costs for training, software licenses, and technical support commonly apply.
- Hybrid models — combination of purchased hardware plus contracted operations or creative services for individual events.
Some vendors offer integrated systems for organizations that plan to operate shows in-house; such systems typically include drones, flight control software, and operator training, and therefore carry higher upfront capital cost compared with single-event hires.
4. DIY (In-House) Implementation Considerations
Organizations evaluating an in-house strategy should consider the following cost categories and trade-offs:
- Capital expenditure for drones and control systems — purchasing a certified system involves significant upfront investment.
- Software and licensing — flight planning and choreography software, plus any recurring license fees.
- Training and personnel — certified operators, safety officers, and technical support staff are required for safe operation.
- Regulatory compliance and permits — costs and lead times for local aviation authority approvals, where applicable.
- Insurance and safety mitigation — event insurance and on-site safety measures are recurring operational expenses.
- Logistics and staging — transport, staging, battery charging infrastructure, and secure storage.
While DIY ownership increases flexibility and can be economically justified for repeated use, it requires sustained programmatic investment in personnel, maintenance, and compliance.
5. Comparison with Fireworks Displays
When evaluating drone light shows against traditional fireworks, key comparative factors include:
- Environmental impact — drones produce no pyrotechnic emissions and generate substantially less particulate pollution.
- Safety and noise — drone shows offer lower risk of fire, reduced debris, and typically lower acoustic impact than large fireworks.
- Reusability and long-term cost — drones are reusable assets; over multiple events the total cost of ownership can compare favorably to repeat fireworks expenditures.
- Artistic expression — fireworks and drones offer different aesthetic qualities; drones enable dynamic three-dimensional shapes and animated sequences not achievable with pyrotechnics alone.
6. Practical Guidance for Event Planners
For a responsible procurement process, event planners should:
- Obtain multiple proposals to compare scope, safety plans, and total cost including permits and insurance.
- Request documented regulatory compliance and operator certifications from prospective providers.
- Clarify whether quotes include site surveys, airspace coordination, and contingency plans for adverse weather or technical failure.
- Assess the expected creative scope (2D vs. 3D formations, animation complexity) as this significantly affects price.
- Consider total cost of ownership for in-house solutions, including training, maintenance, and recurring operational expenses.
Conclusion
Drone light shows have matured into a viable alternative to traditional pyrotechnics for many use cases. Cost depends heavily on fleet size, regional market conditions, and whether a turnkey provider or an in-house model is chosen. Event organizers should evaluate both upfront and recurring costs, regulatory requirements, and creative objectives when selecting an approach.
Comments